
Java: Collecting Profiling Data for Performance Troubleshooting Without Interrupting Your Application
By admin on Jun 21, 2008 in Java
There is a mysterious performance issue that I faced recently. The scenario is like this
- I have a Java backend application running on a 4 CPUs, 8 GB RAM Unix Server
- The application connects to a Oracle 10g database server. Whenever it is processing a transaction, it will do the typical database CRUD operations, talks to external application if necessary depending on the transaction context and business rules.
- Typically the server can process up to 20 tps with average processing time of 400ms.
- However, after migrating the application to JDK 1.5, whenever the application is running for roughly a day, the performance will slow down. Now every transaction is taking approximately 10 seconds to complete.
- The behavior is random, in the sense that the slowness is indeterminate within a single transaction.
For the above performance issue, I have tried to simulate it using a server with similar configuration but the problem cannot be simulated.
As such, I need to capture the profiling data whenever the problem happens in production server.
Starting JDK 1.5, you can send a signal to the running JVM to start and stop a profiling data collection period with zero preparation and no interruption of your application.
Zero preparation profiling is a feature of the JDK 1.5. It is started from the command line by sending a signal to the JVM to start eprof. Engaging zero preparation profiling may have a short term impact on application performance as the JVM adjusts to the demands of performing dynamic measurements.
To collect profiling data without interrupting your application, do the following from the command line:
- Find the process ID of the running Java application.
- Start the profiling interval: send a signal to the JVM by typing:
kill -USR2 pid - You will see the following message:
eprof: starting profiling - Let the profiling collection generated by the JVM continue for the length of time that you think will be meaningful.
- Stop the profiling interval by sending the same signal to the JVM:
kill -USR2 pid - You will see the following message:
eprof: terminating profiling writing profile data to ./filename.eprof - You can now open the saved file in any tools that can read the profiling data and view the collected metrics.
Here is a sample of mine.
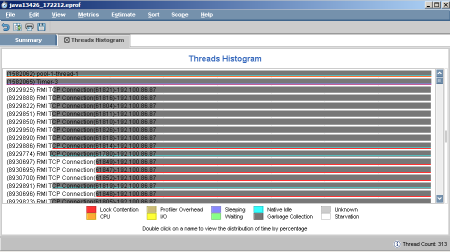
As you can see, there is garbage collection during that time which takes up all the CPU.
In coming post, I am going to show you how I drill down further into this issue.

1 Trackback(s)
Sorry, comments for this entry are closed at this time.